I have never really explored Apple’s Safari’s web inspector, nor have I ever found or wished there to be any use in it. I use my own source-files to debug and check my sites, and I also happen to use the built-in code-editors in some of the PHP software I use.
Due to my sheer ignorance of this perhaps marvelous feature of Safari I have never (with emphasis on never) touched the Console and Network buttons! Until today, when I practically stumbled upon them both by mistake.
The Console feature
Pressing this button/tab takes you to a console with one line of code-input. What this thing enables you to is to run specific JavaScript commands to test and debug various features you may have. I have personally yet to find use for it, however I can definitely see large websites with a lot of JS making use of it!
I will further try this out, perhaps even inputting some jQuery code and seeing if something happens!
The Network tab
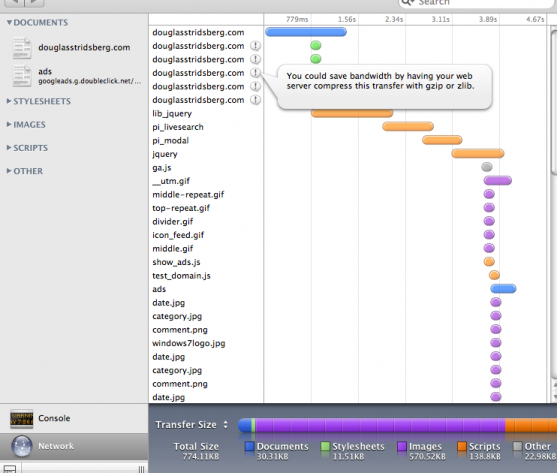
Let me start off by saying the following. The Network feature is awesome. As the picture depicts, it is all about load-time. What objects load? When does an object load? Where does it load? How long time does it take to load it? Is there anything I can do to improve this? The graph to the right of Transfer Time takes you back to the intuitive interface of iTunes and it’s graph of the layout of your iPod harddrive… All this is something I have found use for (and which I can’t see how anyone wouldn’t!) and which I will be using in the future!
One reply on “The Safari Web Inspector and it’s Console”
Thanks for helpful information you catch up us with your instructional explanation.